-200h.png)
Data Analysis


My Portfolio
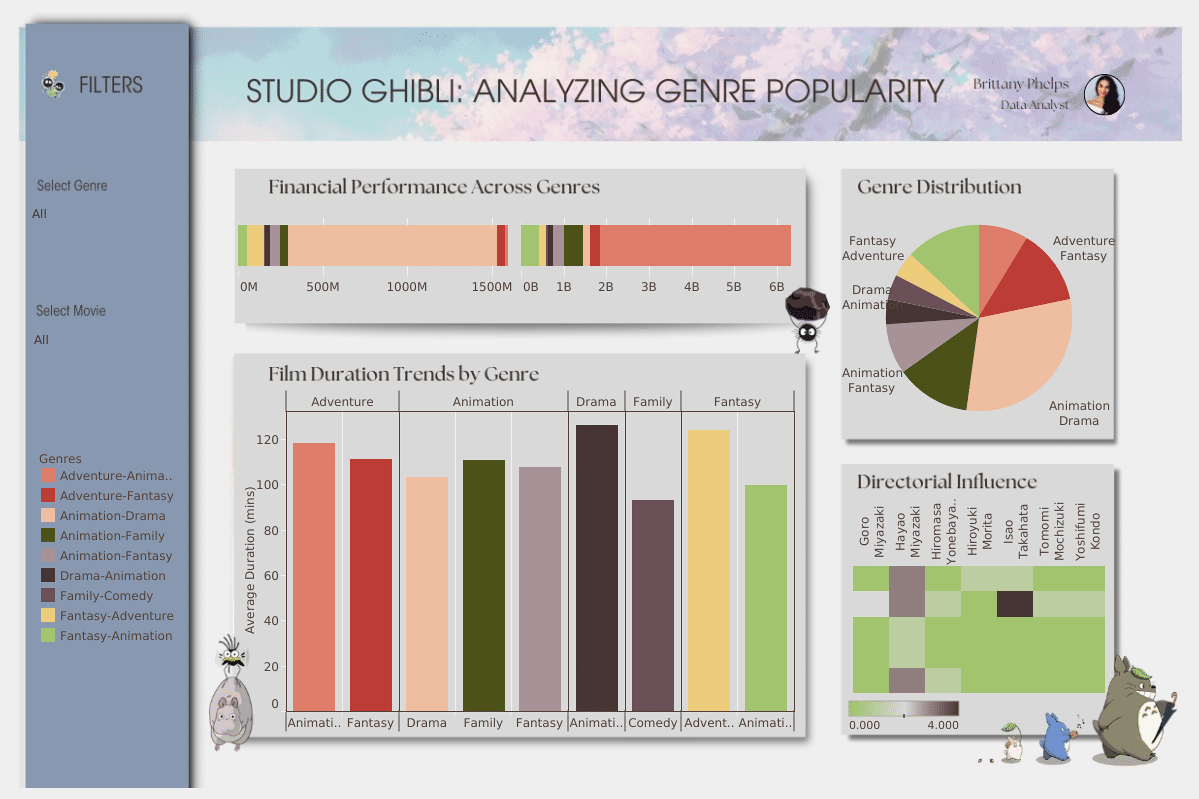
Take a look at my recent projects, dashboards, and data visualizations.Python | Pandas | TableauStudio Ghibli Genre Popularity Analyzed Studio Ghibli data to determine the most
popular and financially successful genres in order to
guide future film projects and marketing
strategies.
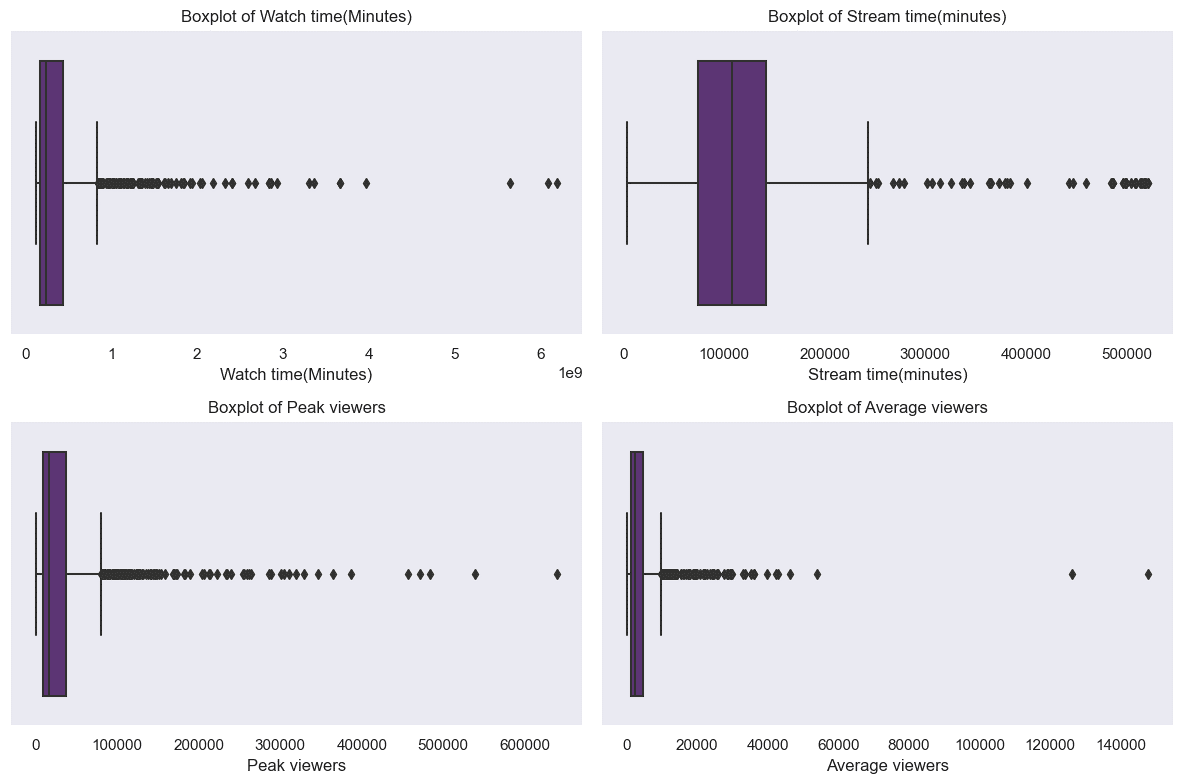
Python | Pandas | Matplotlib | SeabornTwitch Streamer AnalysisAnalyzed Twitch Streamers' data to discern patterns
in streamer performance metrics such as viewer counts,
watch times, and followers gained.
Pandas | Plotly | Python | Dashboards
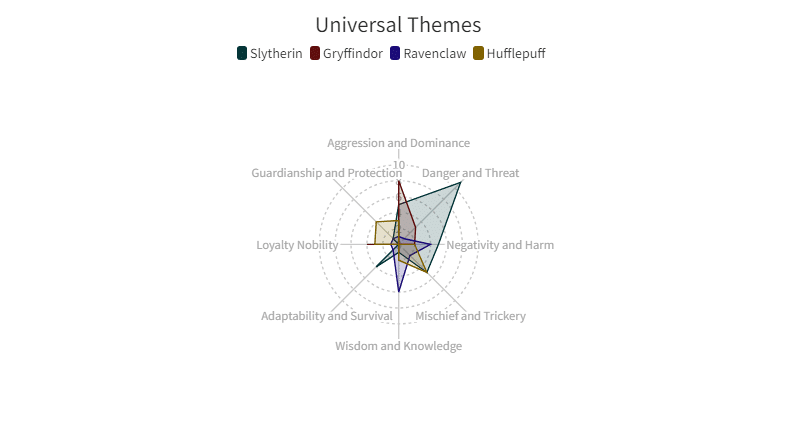
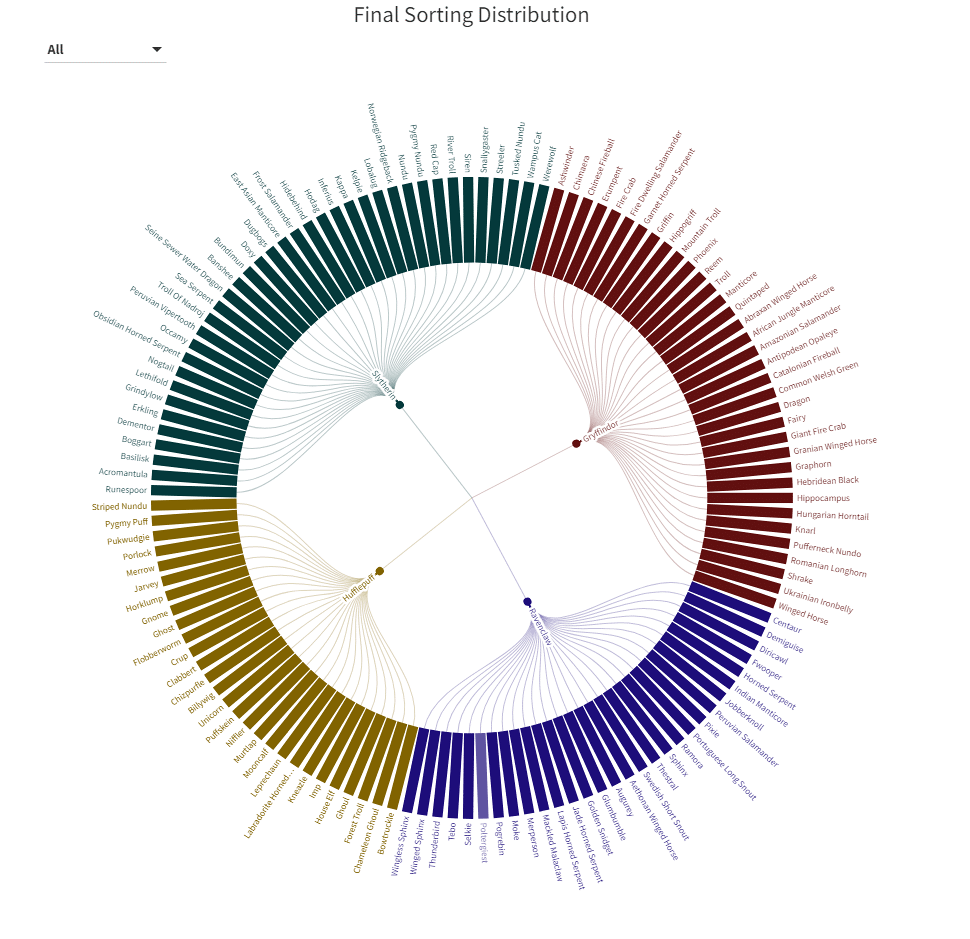
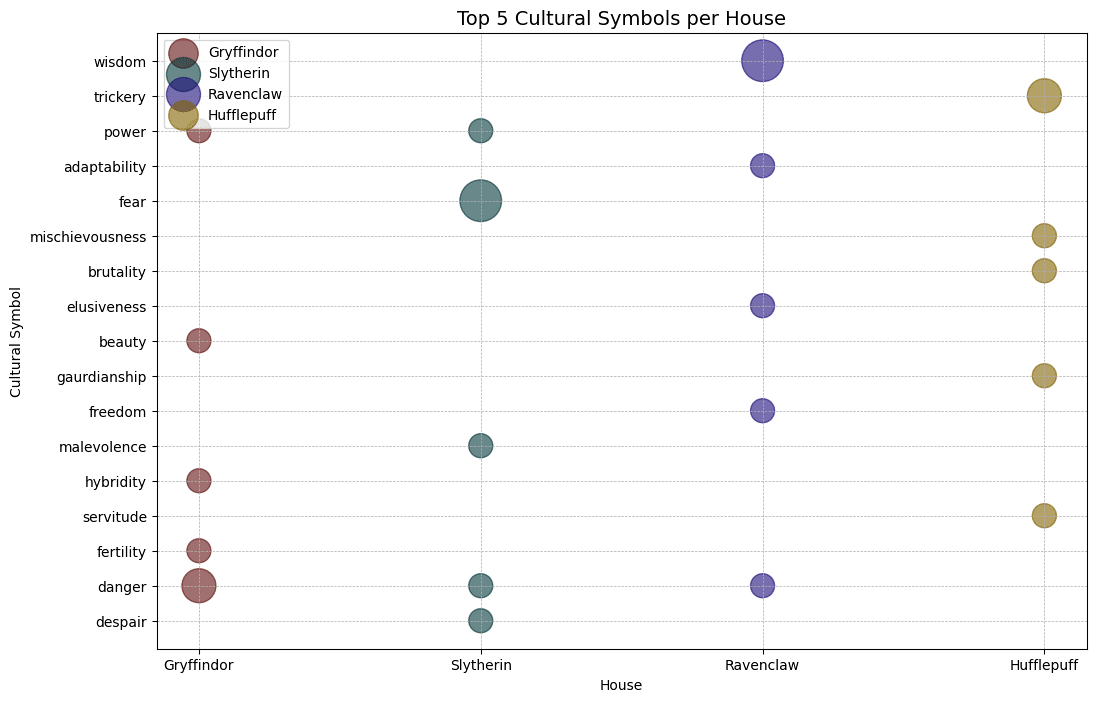
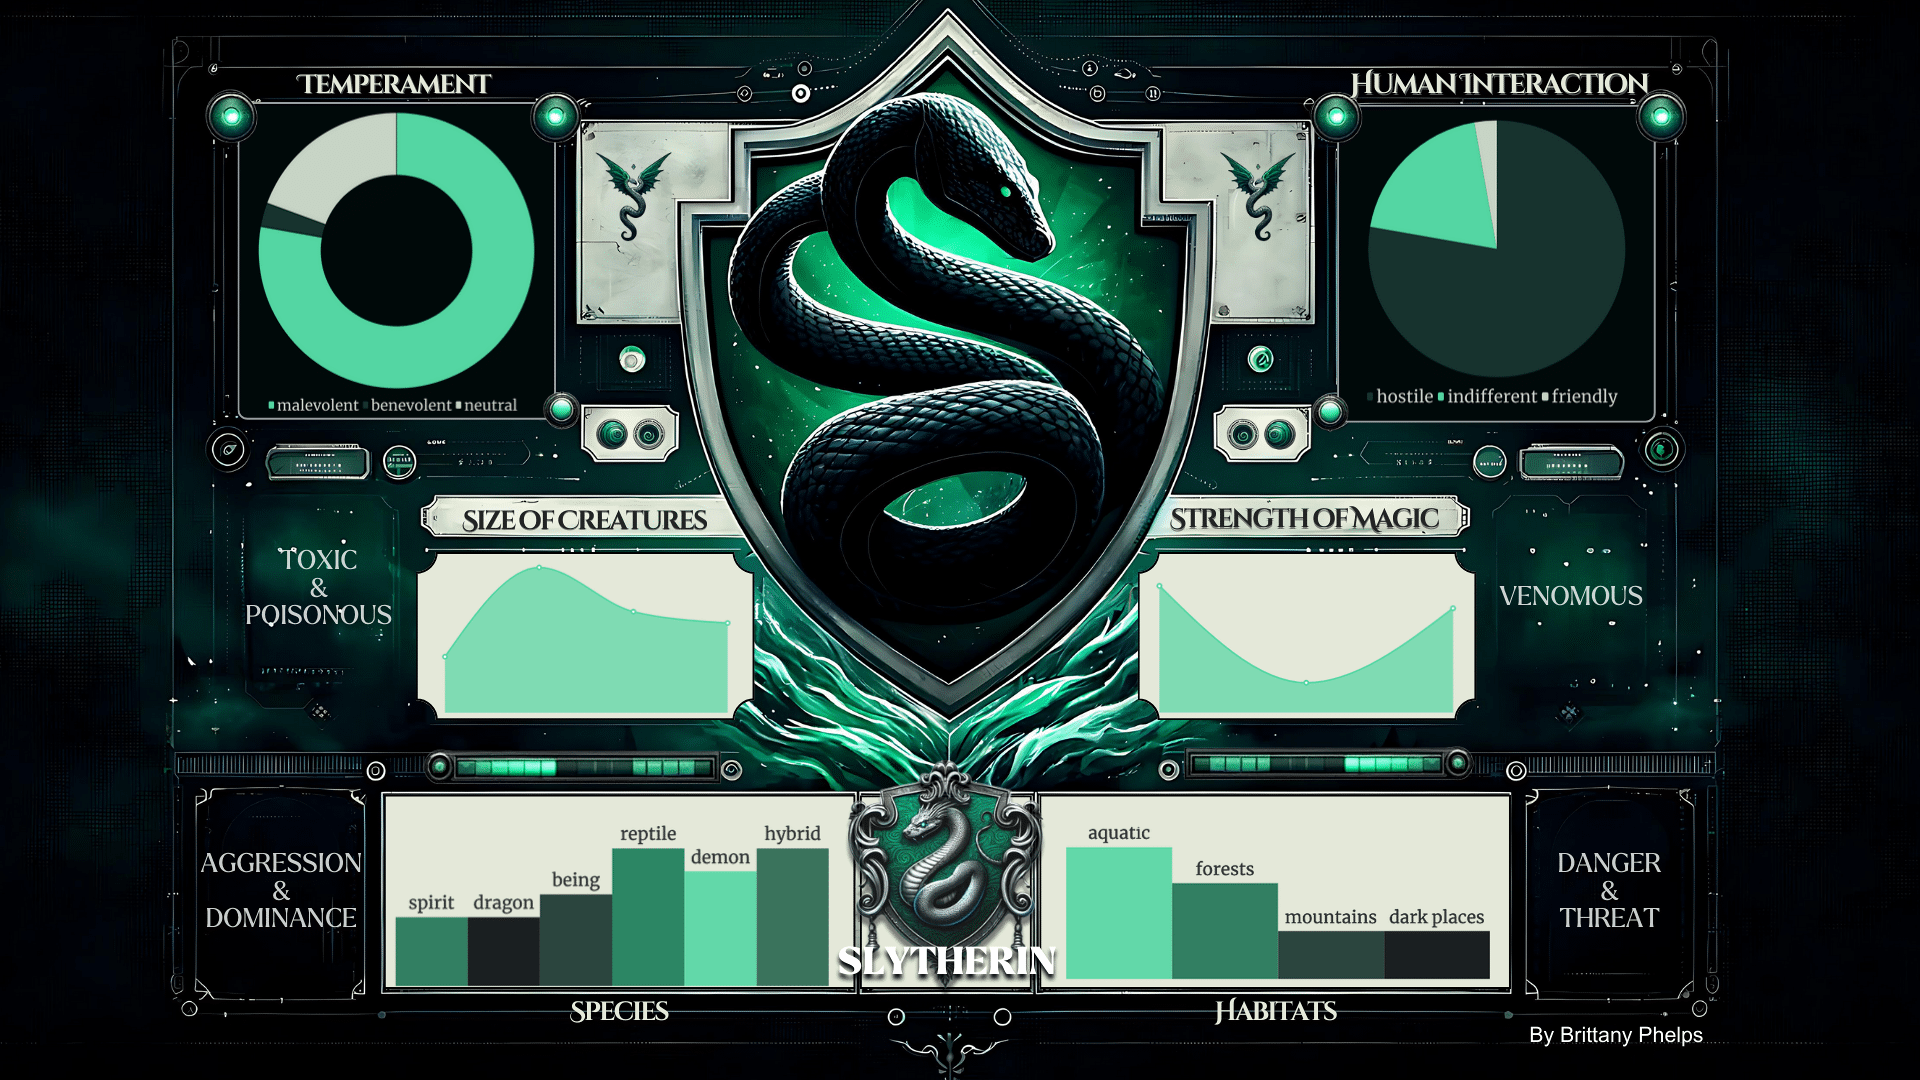
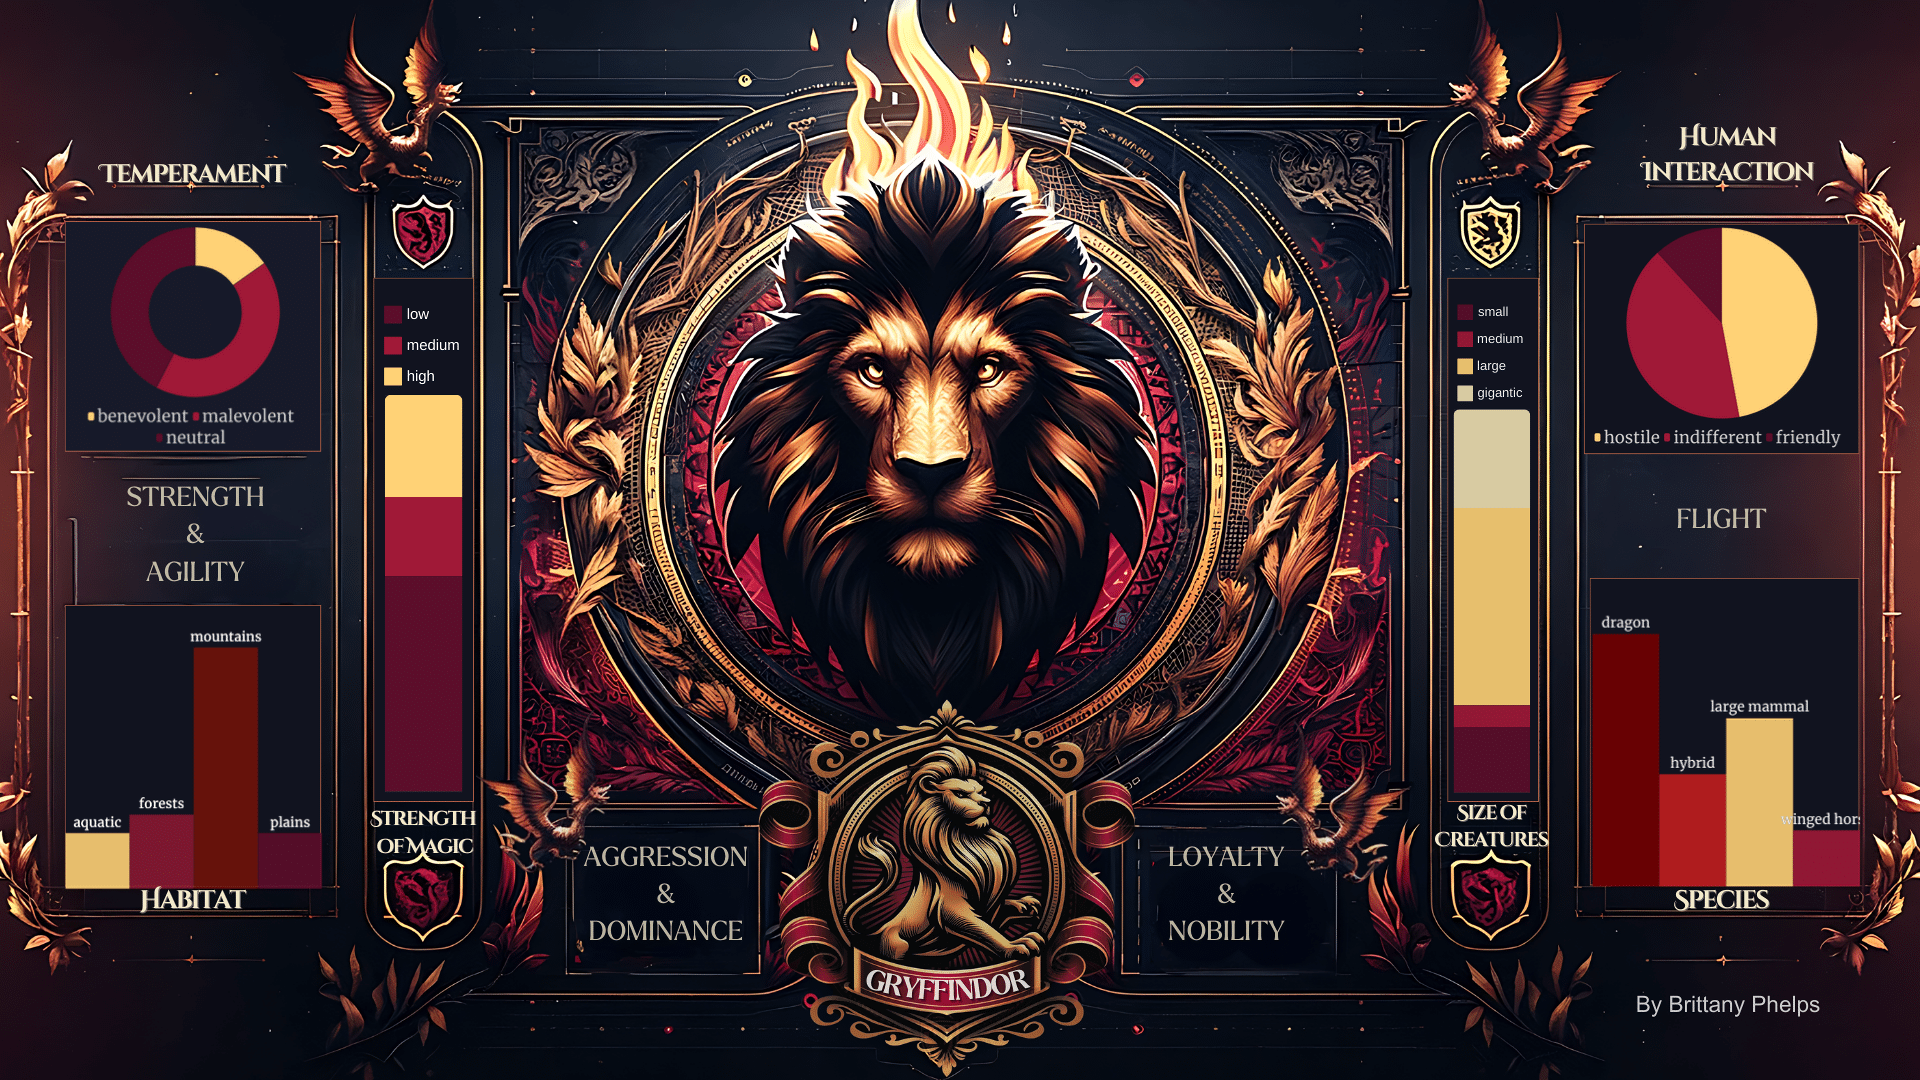
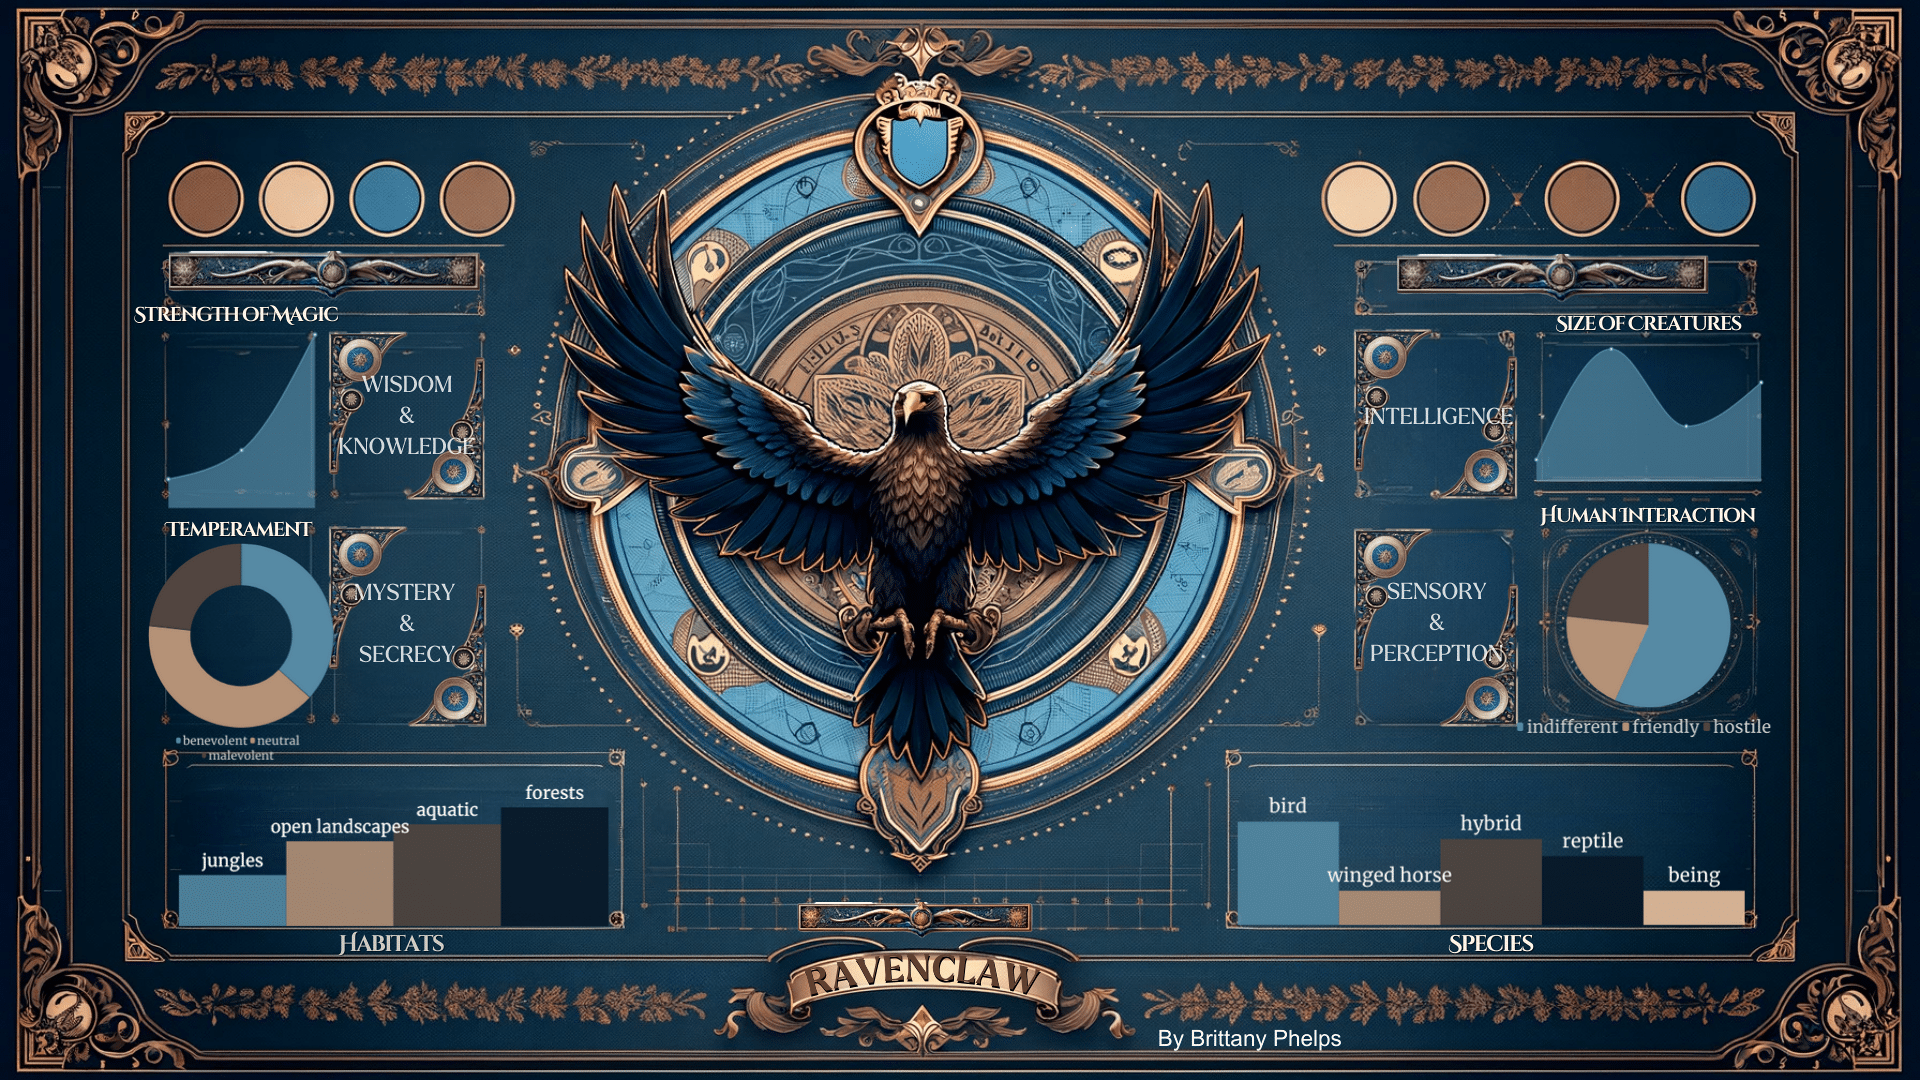
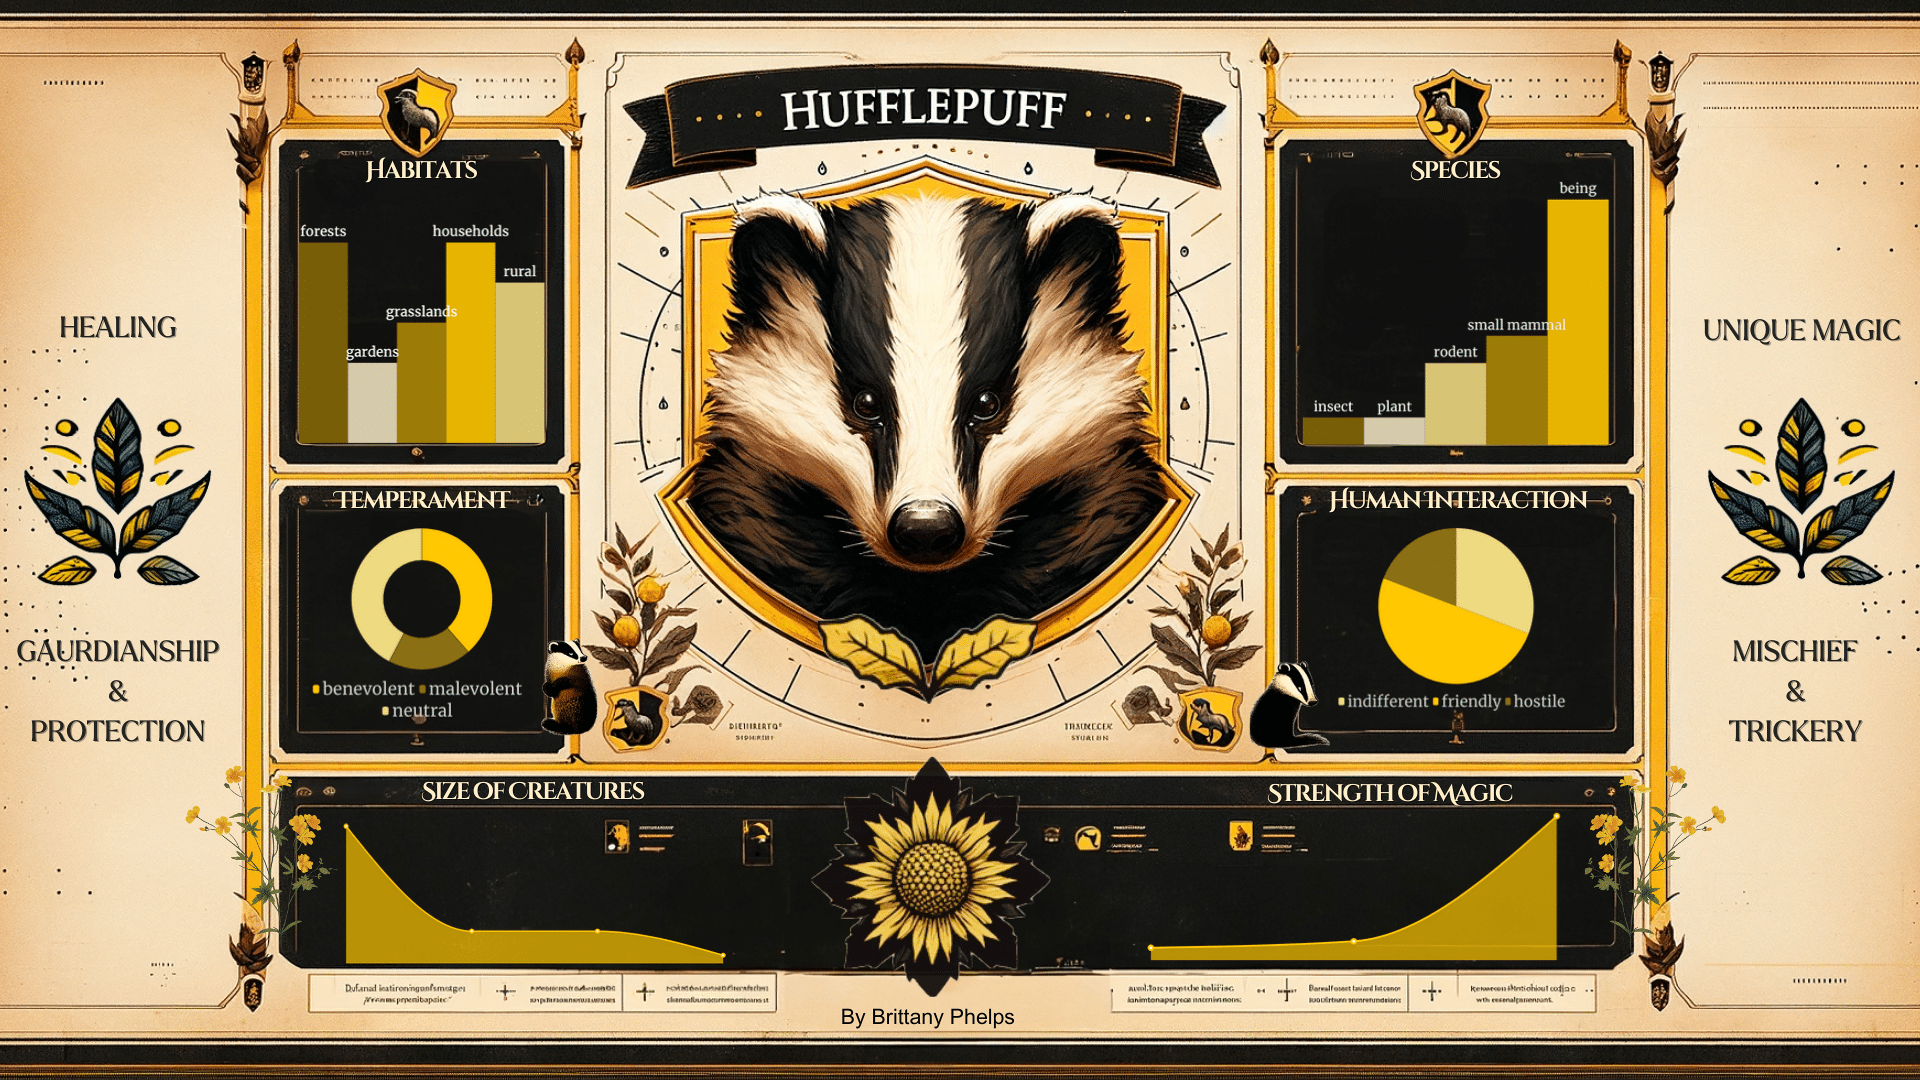
The Hogwarts BestiaryDeveloped a custom sorting algorithm to categorize
creatures into Hogwarts Houses and analyze any
creature-house affinities within The Wizarding
World.
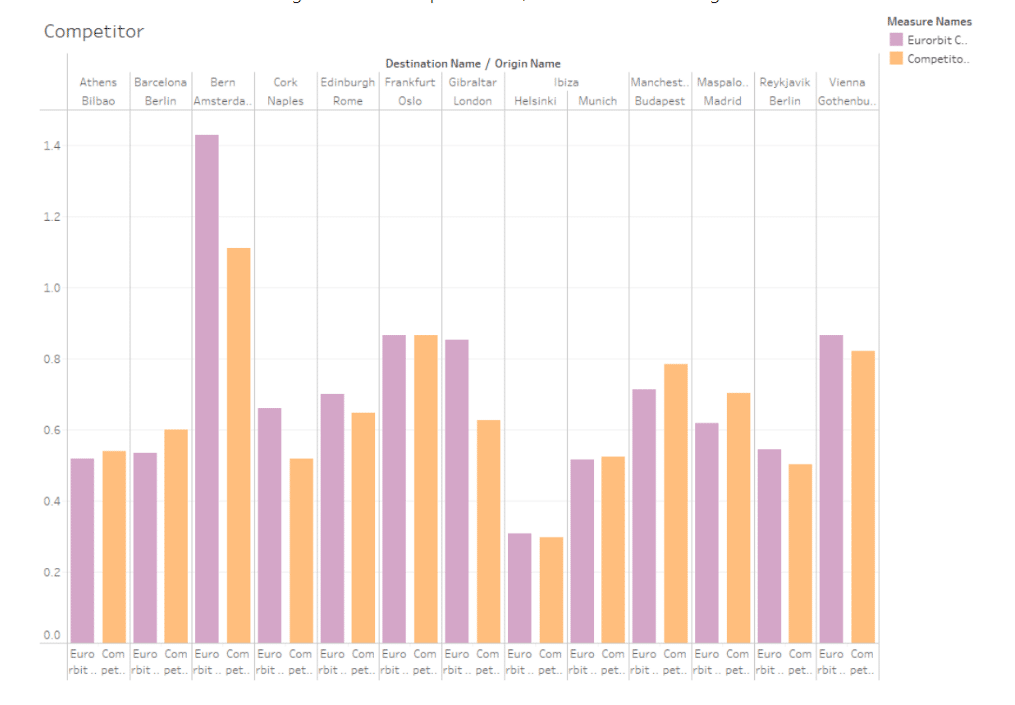
MySQL | Tableau | ETL | Data Models | Data Governance
| Business Intelligence
Data Warehousing with OracleBusiness Intelligence Operational Analysis and Data
Modeling to Explore New Markets
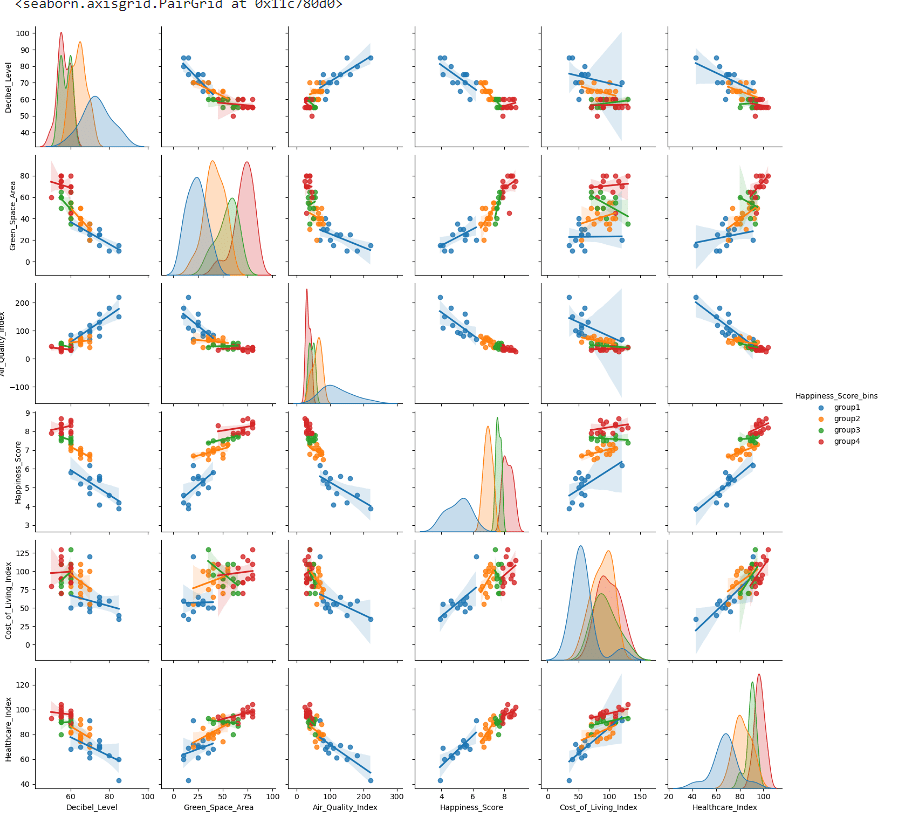
Python | Regression Models | Correlation
AnalysisCity Happiness Index EDAExploring factors affecting the well-being &
satisfaction of the population in urban
environments.
MySQL | ExcelInventory Efficiency and Warehouse OptimizationAnalyzing Mint Classics' Storage facilities,
providing recommendations for inventory
optimization.
Data Viz
Data Visualizations
Data Visualizations
Spatiotemporal Information
Global creature-house distributions.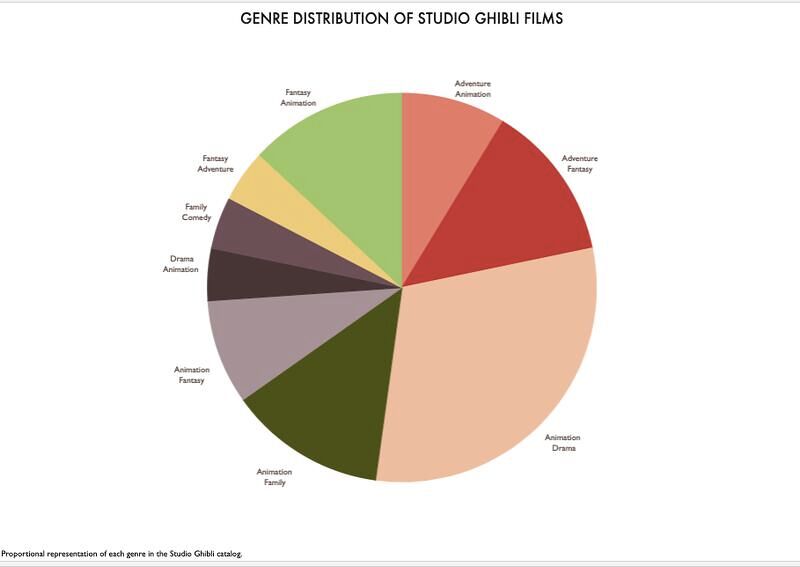
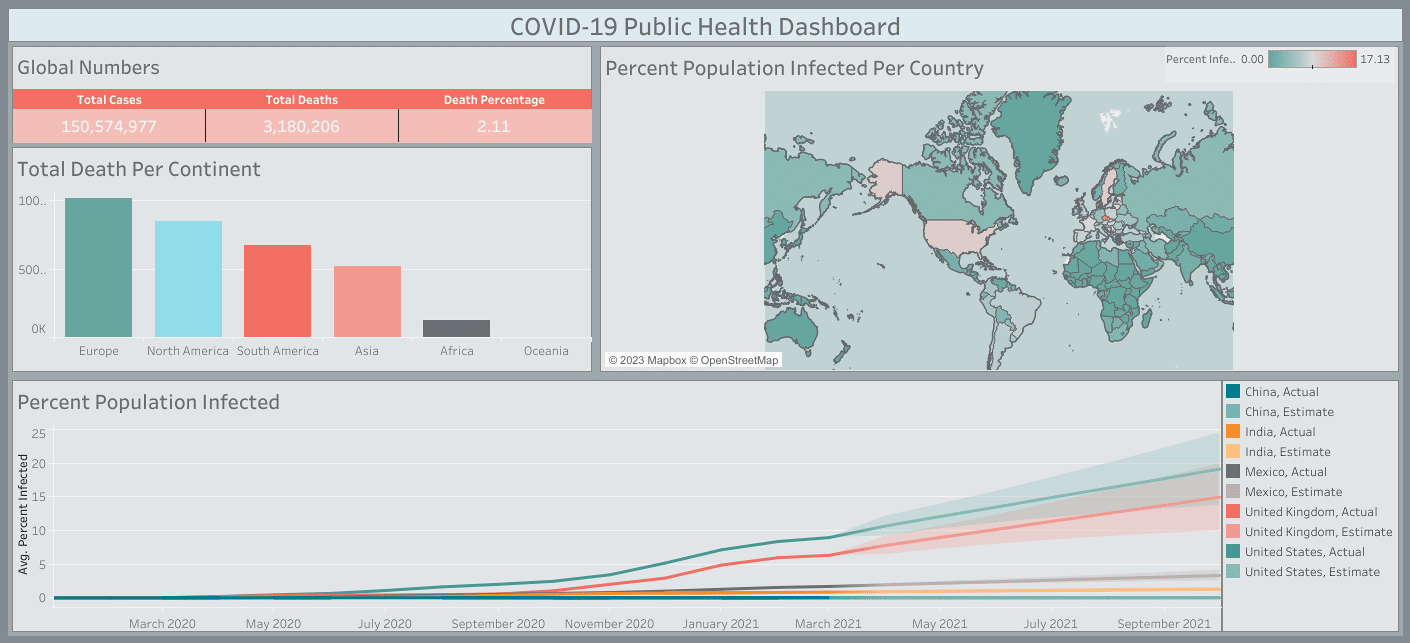
Infection Rate Map
Showing differentiation in population infection rates across the globe.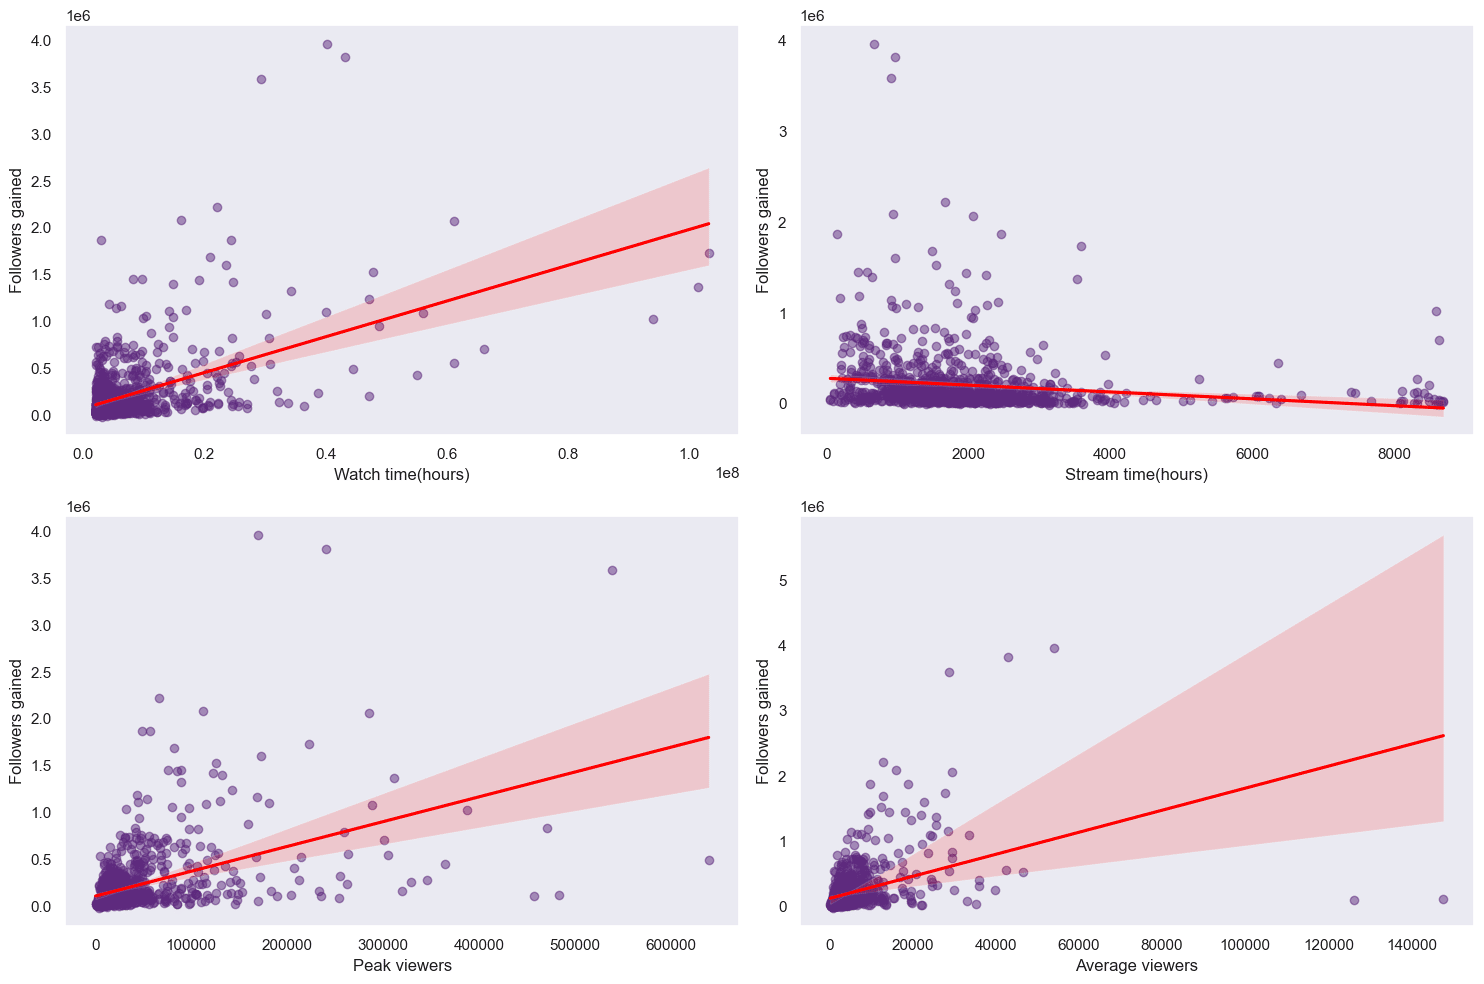
-1500h.png)